Data Science Project: NYC SAT Visualization
NYC_SAT_DataVisualization_R
Contributors
- Shon Inouye
- Elliot Villalpando
- Tiffany Cheng
- Evan Azevedo
Abstract
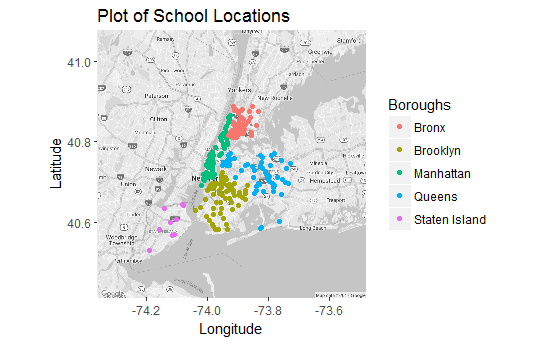
We present data visualization for SAT scores of accredited high schools in New York City for the 2014-2015 school year. We used a dataset from Kaggle. The analysis is done in R.
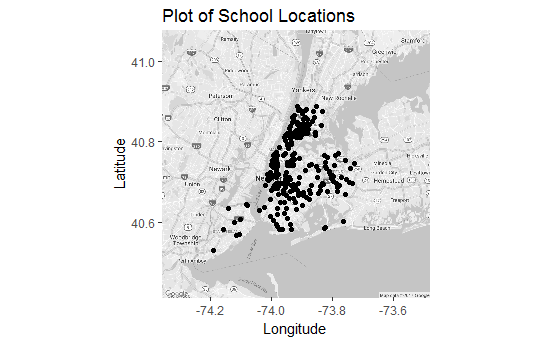
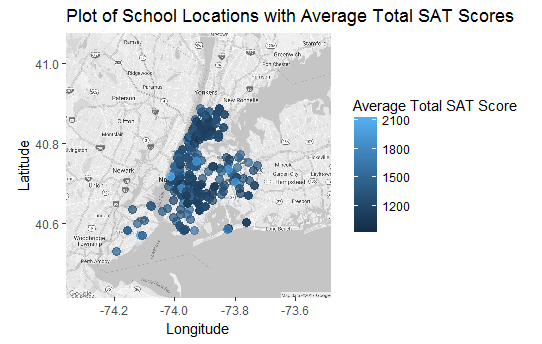
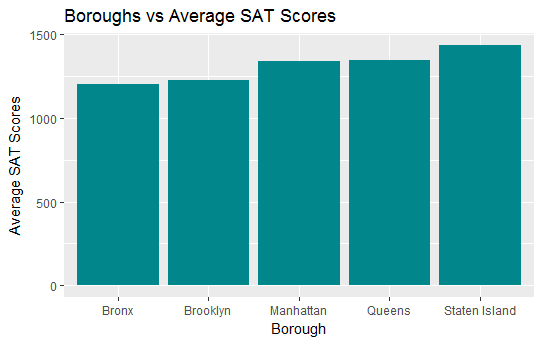
Visualizations